As you probably figured out if you follow me on Twitter, I had the pleasure of attending South by Southwest Interactive this year. (Only my second time, and the first since 2006.) I went to over 15 different panels and talks, and most were excellent. I did a lot of live-tweeting of the good ideas from them as @HASTAC (a shared work alter ego).
Only one session inspired me to actually take notes and it was the shortest one I attended. Visual Problem Solving: 5 Diagrams in 15 Minutes was led by Dean Myers who quickly demonstrated the use of 5 techniques for visualizing thought processes. I consider myself a mostly-visual thinker, but I’m also pretty linear/logical in my thought (and I can’t draw at all) so I’m a big fan of diagrams. I was familiar with most of these examples, but I really appreciated how they were presented as a toolbox, with the different advantages and features of each.
So with no further delay: here are my notes from this session. Sorry I haven’t had time to illustrate it visually as I should, so I am scanning in Dean’s hand out…
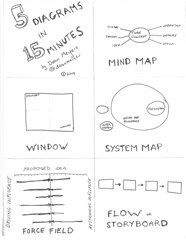
- Mind map
Starting with one central concept and iteratively branch out into related ideas, next steps, etc.
Value-neutral.
- Window
The SWOT matrix is a common example of this.
Two axes, eg strengths-weaknesses and opportunities-threats. includes opinions of the items (as opposed to mind map).
- System map
Like a Venn digram. Circles may be separate, overlapping, nested.
- Force field
Start with a big T, and create horizontal bars using the vert axis, showing how far each item is on the left and/or right of the scale. eg: Driving vs. restraining factors.
Can also use number values & add them up at the bottom.
- Flow/storyboard
Shapes with arrows, can also use photographs to illustrate, post-it notes for flexibility (can change or move them around).
Notes:
- Personally, I love OmniGraffle for diagramming, but it’s Mac OS only and not free. Xmind was also recommended as an open source mind mapping tool. Wikipedia had a long list of tools which I should check out: http://en.wikipedia.org/wiki/List_of_UML_tools
- memory jogger, PMBoK. http://goalqpc.com
- periodic table of visualization methods. http://www.visual-literacy.org/periodic_table/periodic_table.html
Thanks, I missed this session, but looks good. Some of those are new to me (forcefield and system map) so looking forward to trying them out.
Alos missed you at SX! Hopefully will run into you next year. I’m still here for the music portion right now. Very different scene than the first 5 days 🙂